To understand the system better, let’s look at some examples. These examples will give you a feel for the overall flow of a sassy-enhanced program, and allow you to see how the functions work together.
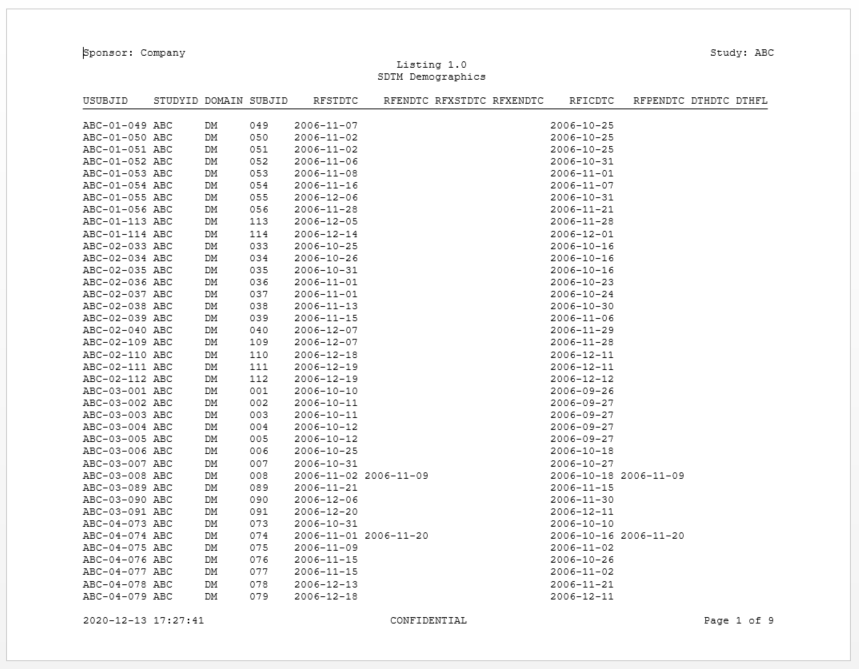
Example 1: Creates a simple data listing and log
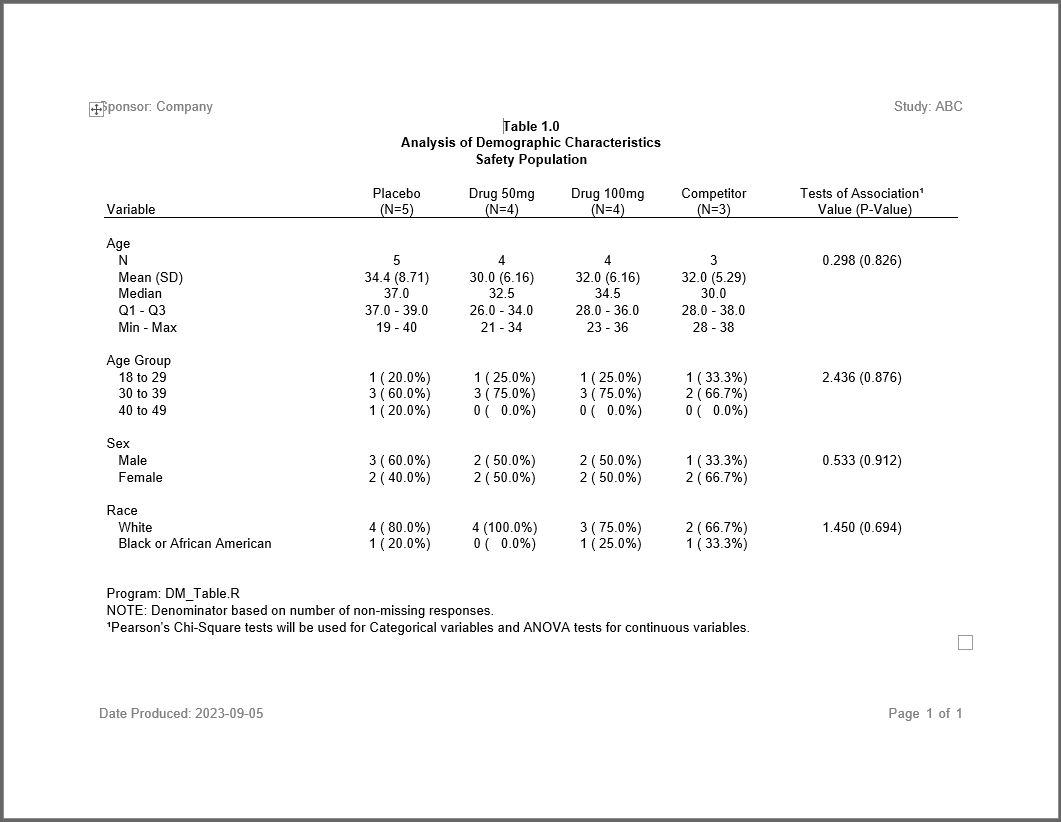
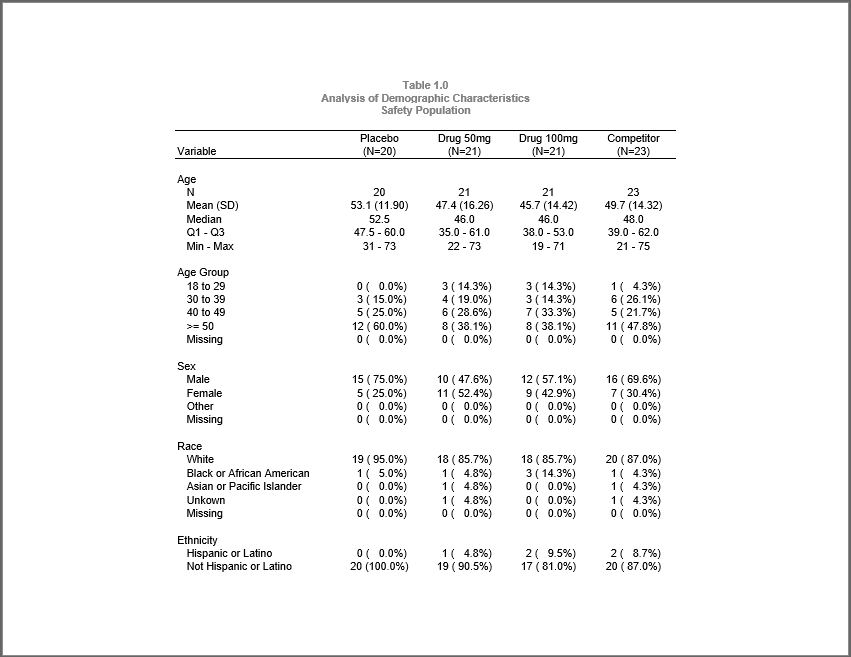
Example 2: Creates a table of demographic characteristics
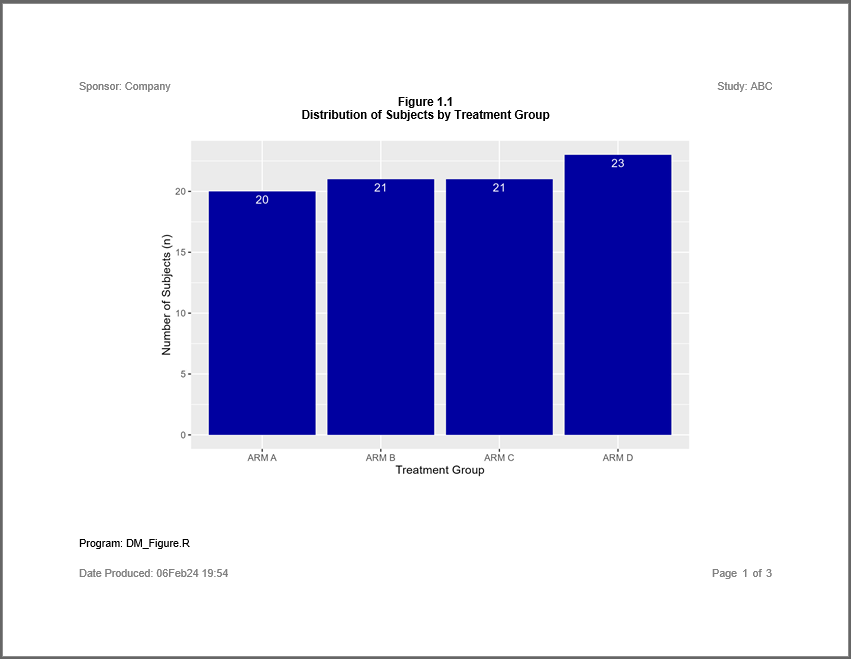
Example 3: Creates a simple figure
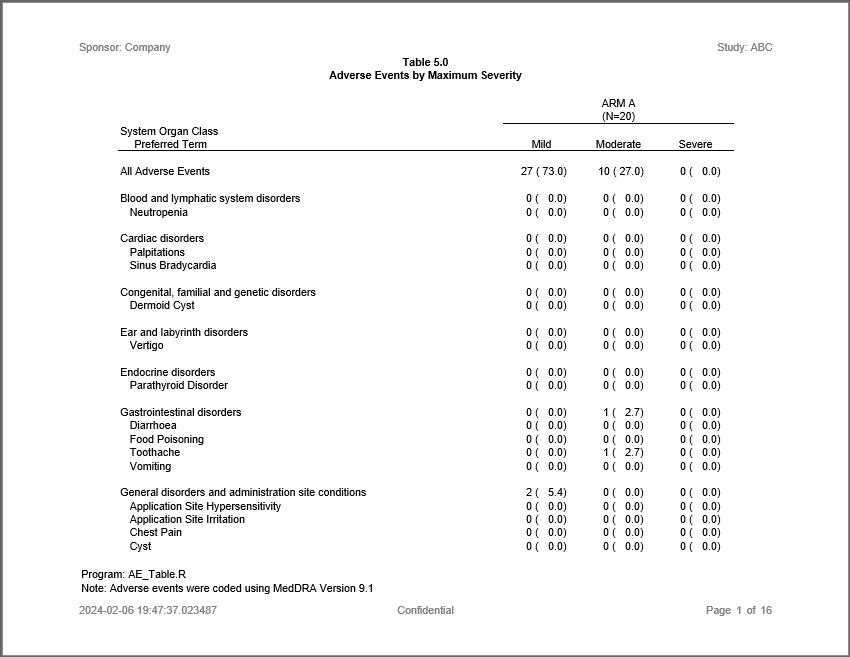
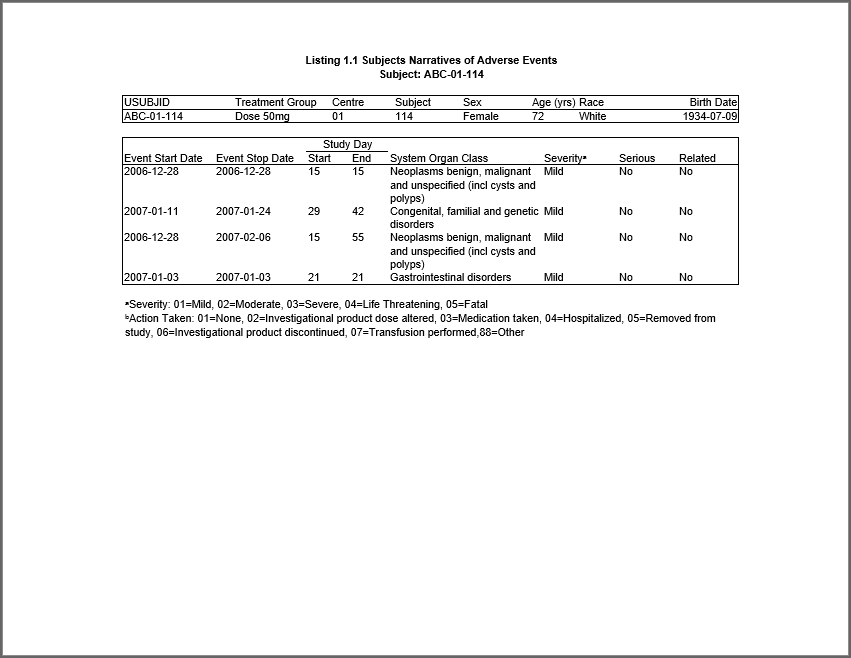
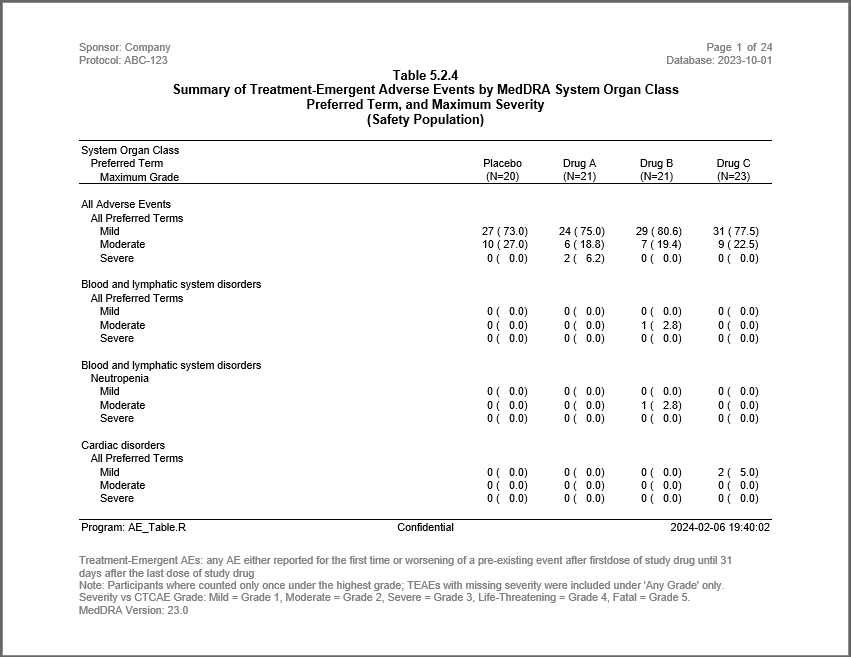
Example 4: Creates an AE table with a page wrap
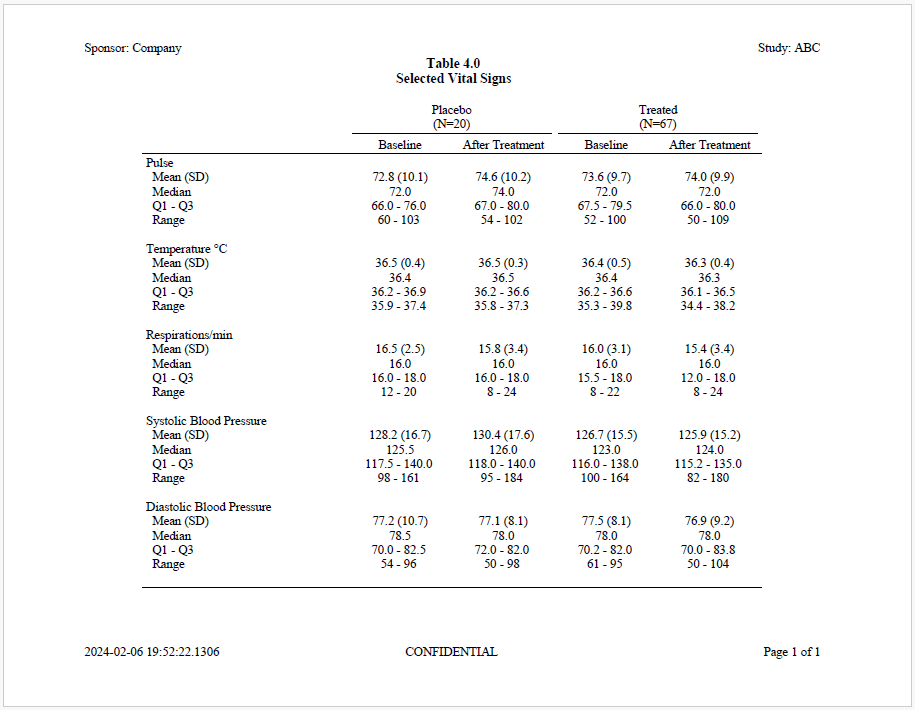
Example 5: Creates a table of vital signs statistics
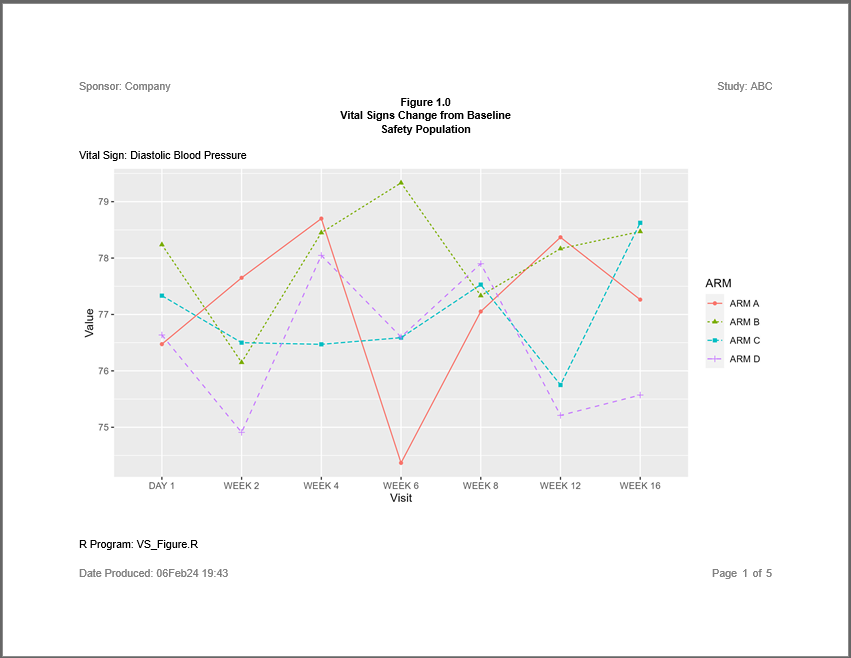
Example 6: Creates a figure with a by-group
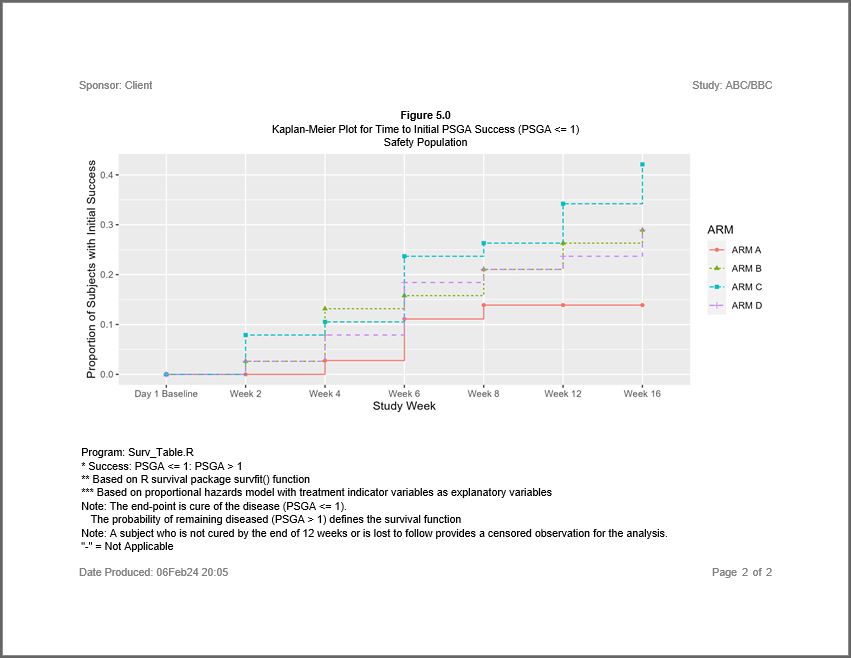
Example 7: Perform survival analysis.
Example 8: Creates a patient profile report.
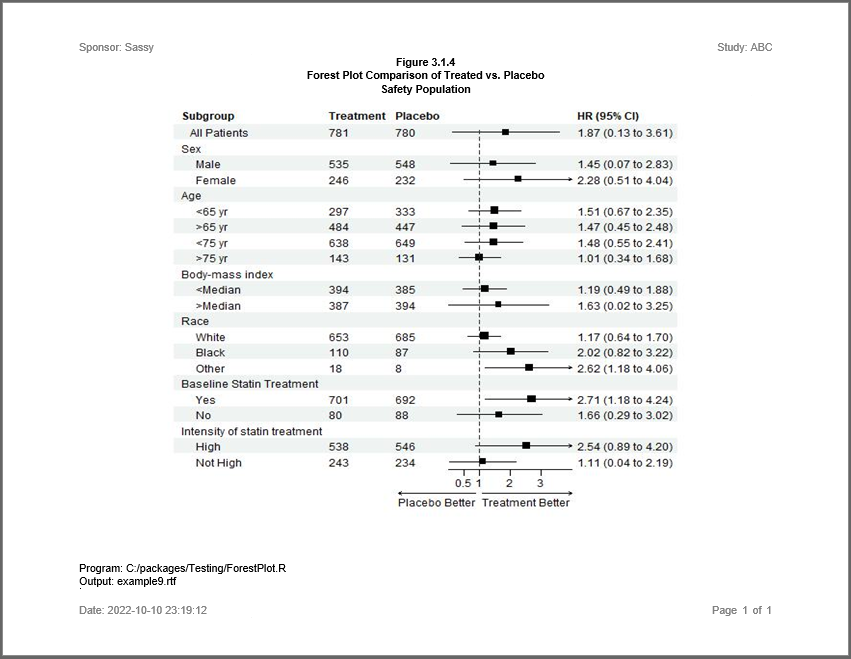
Example 9: Creates a figure with a forest plot.
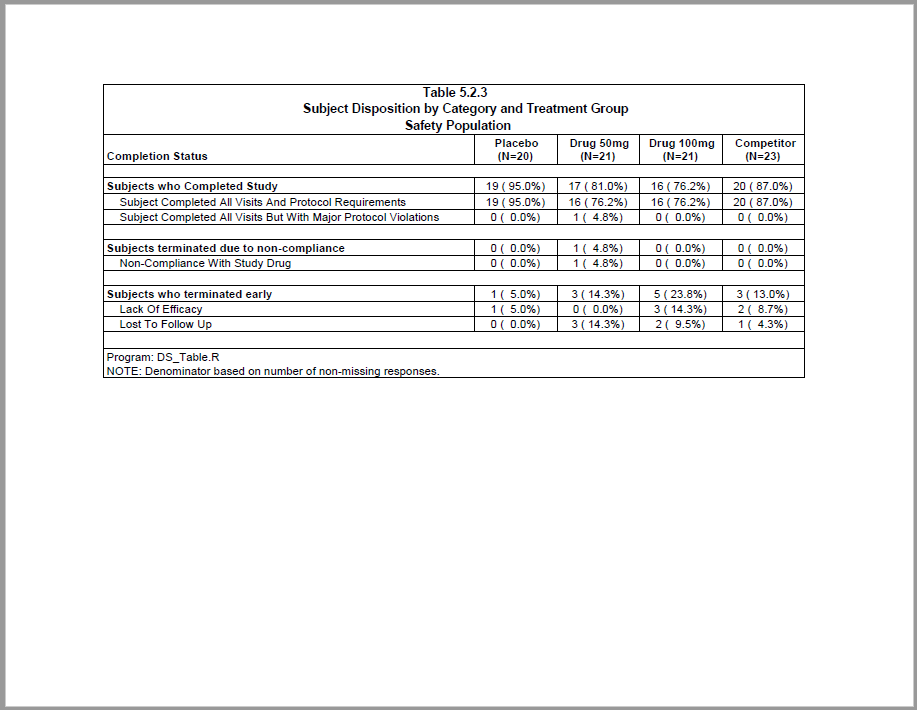
Example 10: Creates a subject disposition table.
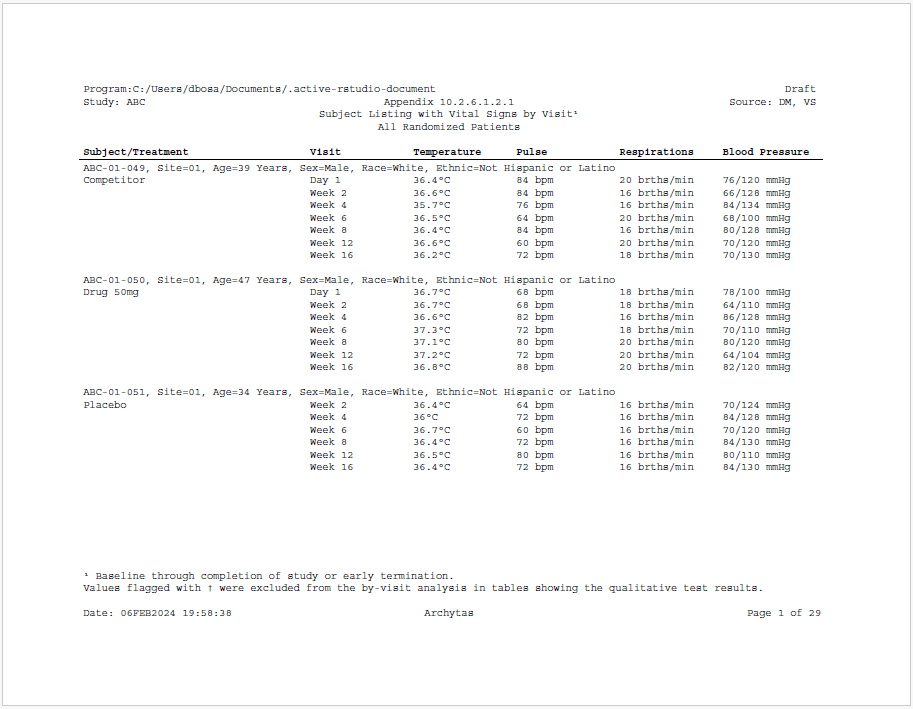
Example 11: Creates a subject listing with vital signs by visit.
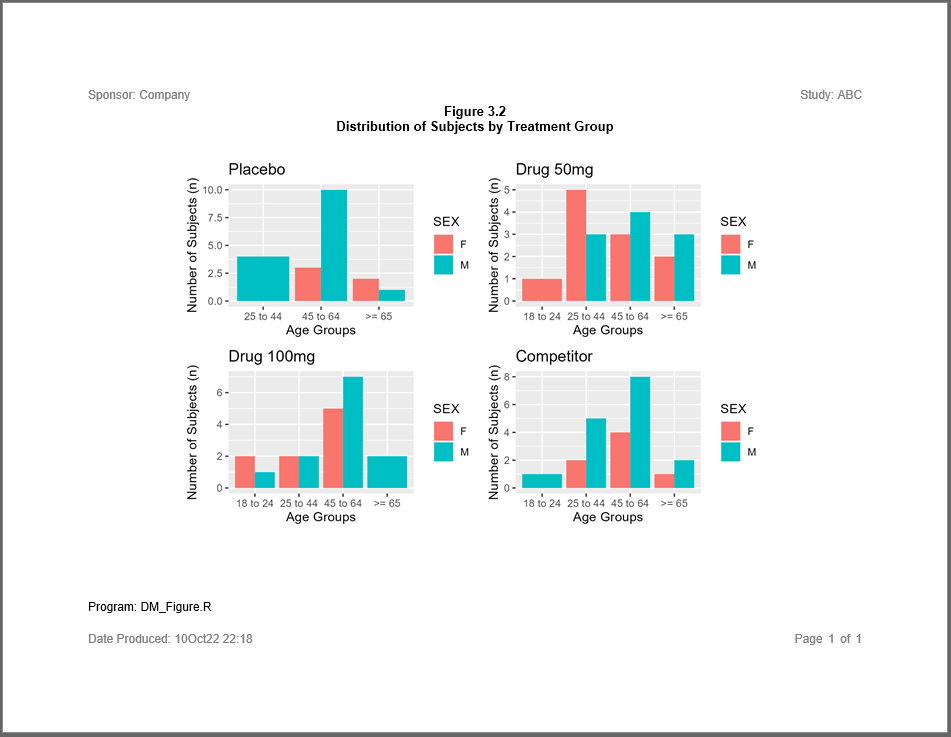
Example 12: Creates a combined figure of age groups by treatment.
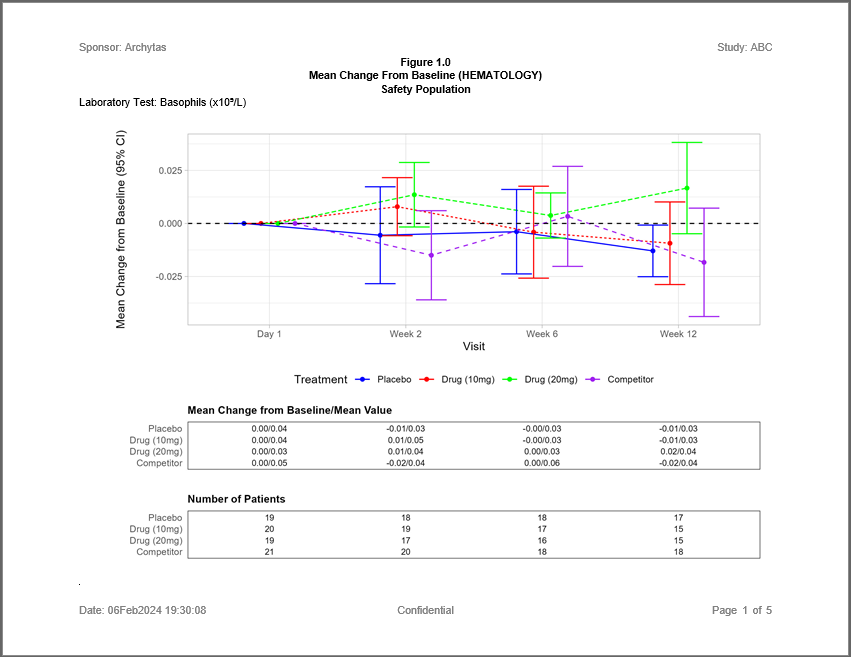
Example 13: Creates a Mean Change from Baseline figure for laboratory values.
Example 14: Creates an AE table with severity grades in rows
Example 15: Creates both stand-alone and “intext” versions of a demographics table.
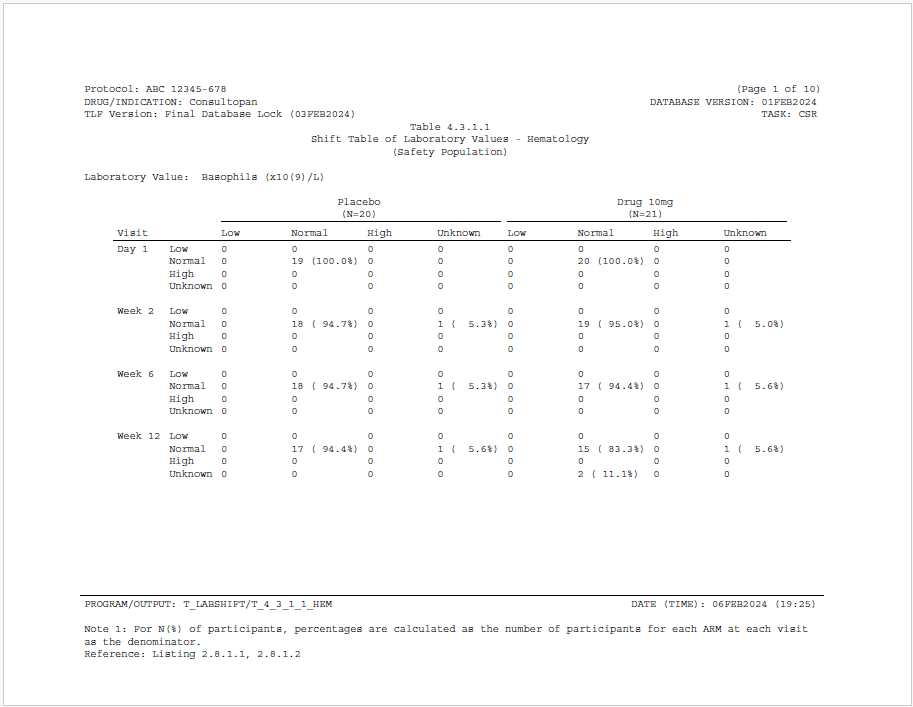
Example 16: Creates a shift table of lab values.
Once you review these examples, please proceed to the package links above to explore the system further!